How far off are stock prices?

How far off are stock prices?
July 15, 2021 | By Professor Christian Opp
Over the past few months, the prices of meme stocks like GameStop and AMC have swung wildly, attracting the attention of investors and raising questions about the informational efficiency of stock markets—the idea that all public information relating to a company’s stock is correctly incorporated into its current price.
In an effort to evaluate stock markets’ efficiency, finance researchers have developed methods to identify so-called anomalies—stocks that predictably outperform or underperform in terms of their returns over short horizons, accounting for risk. By being aware of these anomalies, investors can increase their expected return by tilting toward or away from specific stocks without increasing the risk of their portfolio.
From return anomalies to price level dislocations.
While existing findings regarding return anomalies are valuable for investors, they don’t tell us whether stocks are over- or underpriced for the simple reason that an abnormally high return can either lead to the buildup of mispricing or its resolution.
In a recent research paper produced in collaboration with Jules van Binsbergen, Martijn Boons, and Andrea Tamoni, we develop a method to determine which return anomalies are in fact associated with over- and underpricing, and which ones exacerbate price dislocations (what we term build-up anomalies) or resolve them (what we call resolution anomalies). Our paper also provides a ranking of anomalies based on their effect on aggregate economic outcomes. In other words, we explore which anomalies are likely to translate into material investment distortions by firms.
By analyzing 57 of the most commonly considered return anomalies, we came up with three major conclusions:
- Mispricing exhibits large variation, with double-digit percentage magnitudes.
- A substantial fraction of anomalous returns leads to the buildup of mispricing. Our most prominent examples of such build-up anomalies are stocks with extreme recent past returns in one direction (momentum) and extreme recent profitability.
- Price level distortions affect a substantial fraction of the aggregate market and are prevalent among firms that respond more to market prices, which makes it more likely that stock mispricing also materially distorts firms’ investment decisions.
Understanding the origins of mispricing.
An intense debate rages among academics and practitioners about the origins of return anomalies. Our findings regarding the buildup and resolution of mispricing point to potential explanations.
Take the momentum anomaly—the continued underperformance or outperformance of stocks with extreme recent returns. One explanation for momentum is that investors initially underreact to news, implying that the momentum return is itself the resolution of existing mispricing. An alternative explanation is that upon receiving bad news, investors overreact and push down prices further, in which case the momentum return creates mispricing. Our approach helps disentangle these two behavioral explanations, favoring the latter over the former, since we find that momentum is a build-up anomaly.
Practical applications.
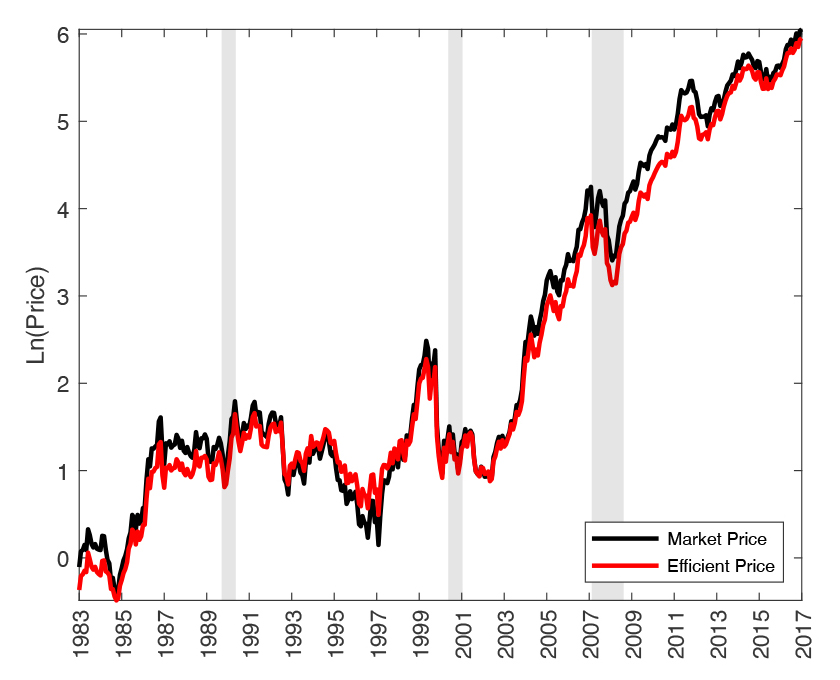
Apple stock provides a perfect example of the estimates our method yields. In Figure 1, we show time series estimates of the deviations of each stock price from its fundamental value. Both Figure 1 and 2 illustrate the price distortion (termed “price wedge”) we estimate for Apple over the past few decades.
Figure 1
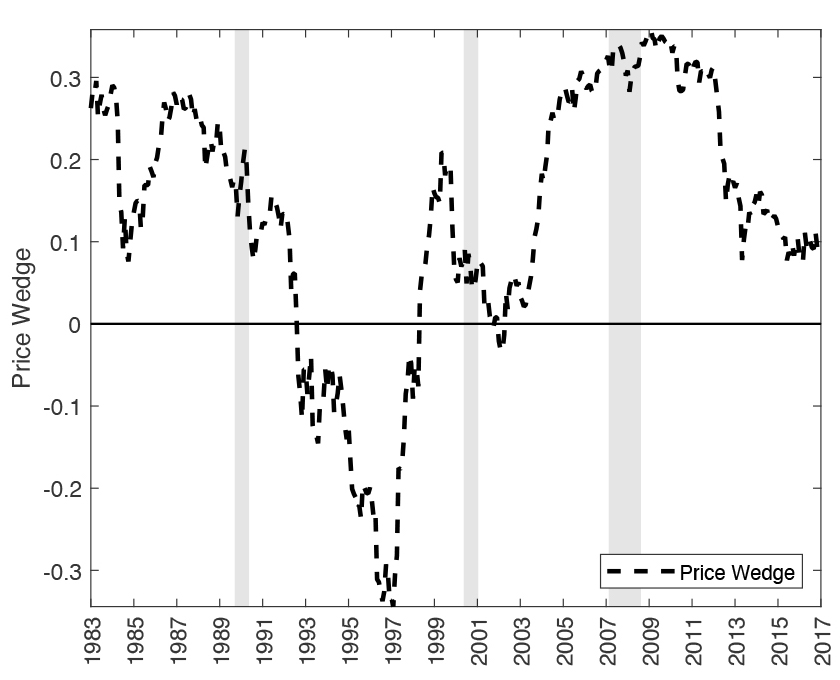
Figure 2
As Figure 1 indicates, Apple’s price wedge exhibits large and persistent deviations from the baseline of zero.
Starting in 1992, the stock ended up in a negative momentum spiral, resulting in underpricing that bottomed out at around −35% in 1997. At that time, Apple had become a so-called value firm, that is, a firm that trades at a low price relative to the book value assigned by accountants.
Firms with this characteristic tend to outperform in the future, which combined with the appointment of Steve Jobs as CEO, turned the company into a momentum firm.
This shift led to several years of momentum buildup, resulting in a positive price wedge of about +20% in 1999. The price then converged back to fair value over the next three years before entering a prolonged positive momentum spiral. Propelled by these high returns, Apple turned into the ultimate growth stock for the next seven years, after which the price largely converged back to fair value by 2017. These patterns illustrate typical dynamics we find for many prominent stocks.
The bottom line.
Our recent research findings raise timely questions about the real economic consequences of informational inefficiencies as well as the value that financial intermediaries such as mutual funds can add to society through their trading activity. After all, those fund managers that choose to trade in the same direction as a build-up anomaly in fact further distort price signals, potentially adversely affecting firms’ real investment decisions.
Ultimately, our method allows researchers and practitioners to estimate firm-specific price dislocations. These results may prove useful for future studies examining the interplay between firm-level investment distortions and price efficiency, which remains an important area for future research.

Christian Opp is an Associate Professor of Finance at Simon Business School. His work analyzes financial institutions’ and markets’ impact on allocations, with a particular focus on the role of informational frictions.
To view other blogs in this series, visit the Dean's Corner Main Page
Related Blogs
-
 AGI could emerge within decades, bringing risks like job loss, misuse, misalignment, and even consciousness. Are we ready? Prof. Huaxia Rui explores the stakes.
 -
 The new Department of Government Efficiency (DOGE) sparks debate. Is it streamlining bureaucracy or pushing privatization? Joseph Kalmenovitz unpacks its impact in this Q&A.
 -
 Understanding Creditor Rights and Their Impact February, 26 2025 | By Giulio Trigilia Creditor rights are often seen as a key driver of investment and economic growth, but research suggests the reality is more complex. While stronger protections can improve borrowing conditions in competitive
 -
 Online steering shapes how we shop, but is it fair? Simon professors Andras Miklos & Jeanine Miklos-Thal explore its ethical and economic impact in a new paper.
 -
 AI regulation must balance innovation and fairness. A recent keynote at Simon explored how competition and antitrust shape the evolving AI landscape.
 -
 In this blog, Simon alumnus Josh Goldberg explains the 25-year journey of model risk management.
 -
 In this blog, Dean Sevin Yeltekin points to productivity as the key ingredient that drives US economic growth.
 -
 ChatGPT as a Marketing Assistant October 16 | By Professor Professor Paul Ellickson In this blog post, Professor Paul Ellickson describes the potential of machine learning and Generative AI tools to predict and improve the performance of marketing campaigns. Identifying and optimizing targeted
 -
 In this blog, Professor Alan Moreira unpacks the effects of policy promises on financial markets.
 -
 Professor Narayana Kocherlakota points to real wage decline to explain widespread voter pessimism about the U.S. economy.
 -
 In this blog, Dean Sevin Yeltekin and Simon summer intern Defne Olgun take a closer look at the mismatch between economic indicators and voter perception.
 -
 Partisan Regulatory Actions July 3 | By Vivek Pandey Professor Vivek Pandey presents evidence that the SEC treats firms differently based on political ideology. It’s no secret that Americans are more politically divided than ever. Intense political polarization has crept into every corner of society